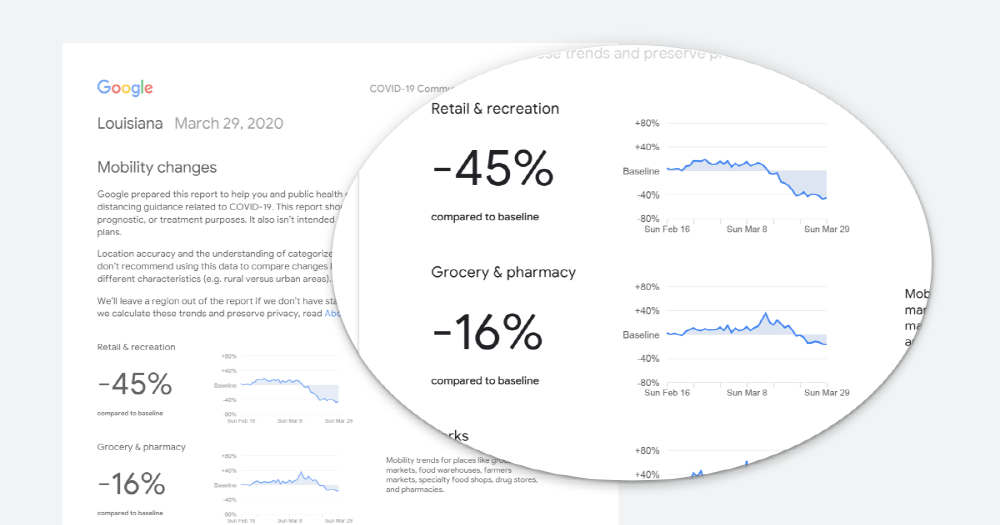
In countries and regions with COVID-19 epidemic, movement to refrain from going out unnecessary is increasing. Google is releasing reports (COVID-19 Community Mobility Reports) that show how much this move has actually reached and how many people in retail stores, supermarkets, parks, stations, work and homes around the world have increased or decreased.
The data released by Google is based on account information that has turned on location history with the Google smartphone app. As there are hundreds of millions of users around the world who use Google Maps, etc., the data that can be obtained by turning on some of the user’s location records is large. In addition, in the collected data, personal identification information such as personal location, contact information, and movement history is hidden under the Google Privacy Policy, and location records can be canceled in Activity Management during Google Account settings.
When the COVID-19 pandemic, Google classified the collected location data into six categories: retail stores and recreation facilities, supermarkets and pharmacies, parks, public transport facilities such as train stations and bus stops, workplaces, and homes, and how many users increase or decrease by location. Investigation data was released. Google discloses data for each country around the world and can be viewed freely. Korean data can also be searched and downloaded as PDF files .
According to data from March 29, in Korea, the number of people in retail stores and resorts decreased by -19%, and supermarkets and pharmacies increased by 11%. Parks increased by 51%, public transportation facilities decreased by 17%, workplaces decreased by 12%, and residential areas increased by 6%. All of these figures represent the increase or decrease from the current standard of March 29, 2020, based on the median period from January 3 to February 6, 2020. Also, the number of visitors and the length of stay were calculated for the number of people at the seat. Next to the number is also a graph showing how each data has increased or decreased over time.
In the U.S., where COVID-19 is exploding, retail stores and recreational facilities decrease by 47%, supermarkets and pharmacies decrease by 22%, parks decrease by 19%, public transport facilities decrease by 51%, workplaces decrease by 38%, and residences by 12%. It is showing increasing results. In some states in the United States, it is remarkable that the imposition of the telecommuting order is in effect. Related information can be found here .

