The U.S. Ocean and Atmospheric Administration’s NOAA, which conducts research and research on the oceans and atmosphere, releases the average average of 30 years from 1991 to 2020, including U.S. temperature, precipitation, wind speed, and snowfall, in the first week of May 2021. Prior to this, NOAA published data indicating how much climate has changed since 1901.
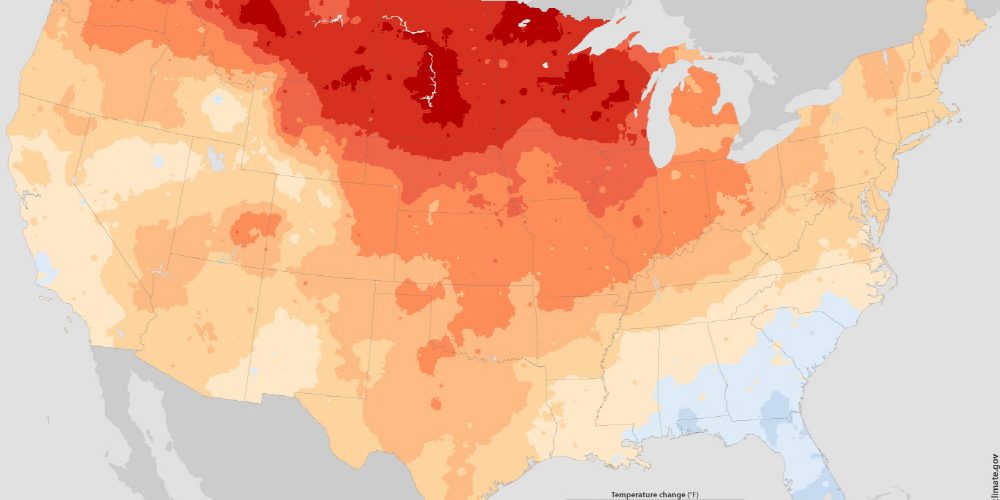
The last update for the average year was updated from 1971 to 2000 in 2011 to 1981 to 2010. At this time, a map was created showing the vegetation zone, which is the range of climate-related vegetation distribution. Compared to the case of 1971-2000, it can be seen that the overall vegetation zone from 1981-2010 is changing to the north. The shift in the botanical zone to the colder north explains the overall warming of the US climate.
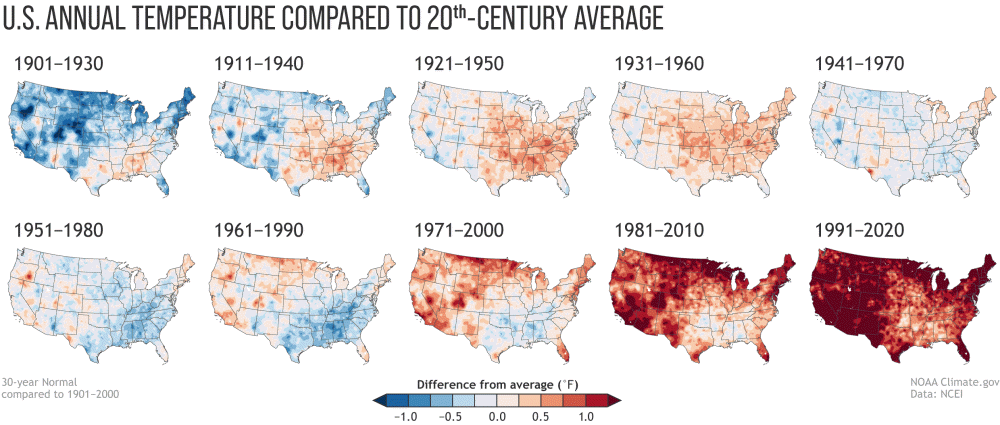
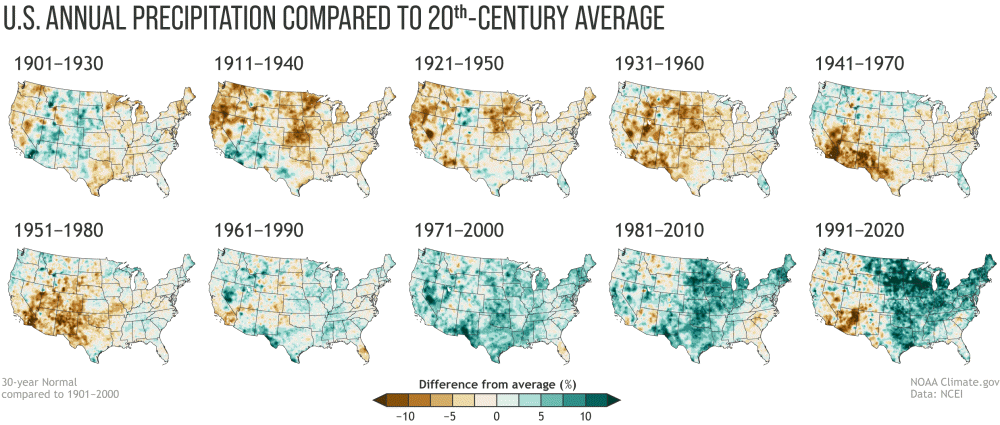
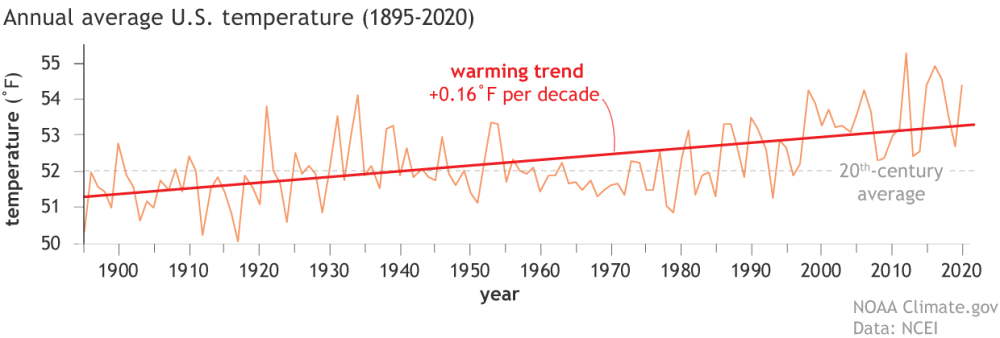
The annual average rainfall for 100 years from 1901 to 2000 is on the rise. If you look at the trend estimates representing temperature fluctuations during the same period, they are biased to one side. NOAA said that while average values are changing, climate change is not overlooked. Related information can be found here.


Add comment