

Increasingly, companies and public institutions are adopting cloud services such as AWS as their own data base. However, the cost of using these cloud services is by no means cheap. How is Netflix, which manages vast amounts of data in the cloud, reducing its data-based operating costs and increasing cost effectiveness?
Budget caps and strict spending limits are usually a way to manage data-driven costs. But on Netflix, which has a highly decentralized data base and values freedom and responsibility, this is counter-cultural and inefficient. To increase data-driven cost effectiveness, Netflix has developed a dashboard that organizes this information to make costs transparent and to place information about cost effectiveness as close to decision makers as possible.
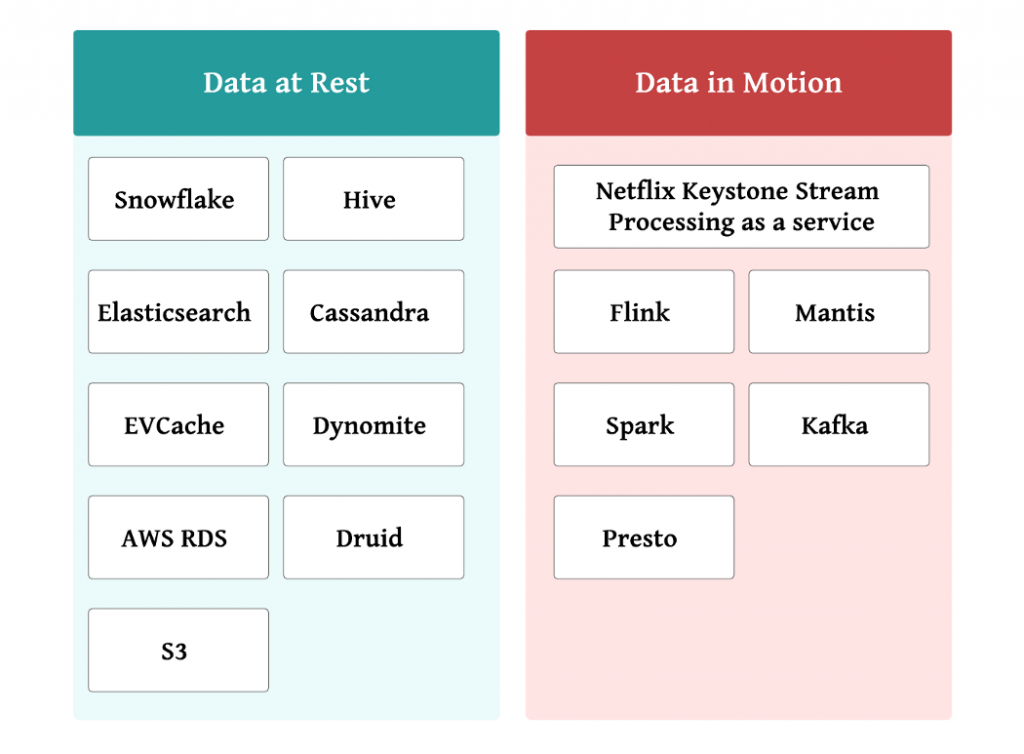
There are two types of data that Netflix handles: static data and dynamic data. Static data refers to data stored in AWS S3, Cassandra, and Elasticsearch. Dynamic data is data processed by Keystone or Flink.
Because these data are held by a variety of teams, in order to figure out the cost on a team-by-team basis, the cost must be aggregated across platforms, as well as break down the cost of a meaningful resource unit such as a table or index. This is the system that Netflix built to realize this decomposition function.
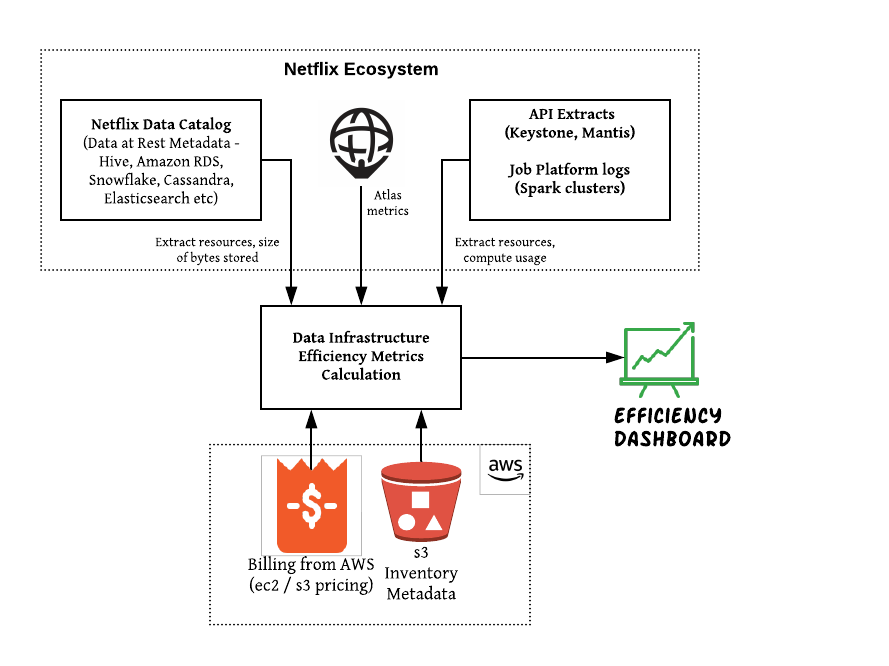
First, AMS retrieves AWS usage charges and S3 inventory metadata. S3 inventory provides a service that outputs object metadata stored in S3. Inside Netflix, Atlas, a system that monitors metrics such as NDC (Netflix Data Catalog), which provides metadata related to data and cost, covering all of Netflix’s data resources, information by dynamic data service API, CPU usage, or network throughput. Atlas), it retrieves information, calculates the cost-effectiveness, and displays it on a dashboard.
AWS usage fees are per platform, such as EC2 and S3, so each team needs to allocate the costs for that platform to understand the cost. For EC2-based platforms, first identify bottleneck metrics such as CPU utilization or memory utilization on the platform. After that, the ratio of recognition by data is calculated through the atlas, and the distribution standard is determined according to the ratio. S3-based platforms use S3 inventory to allocate costs according to the amount of data occupied by S3 storage.
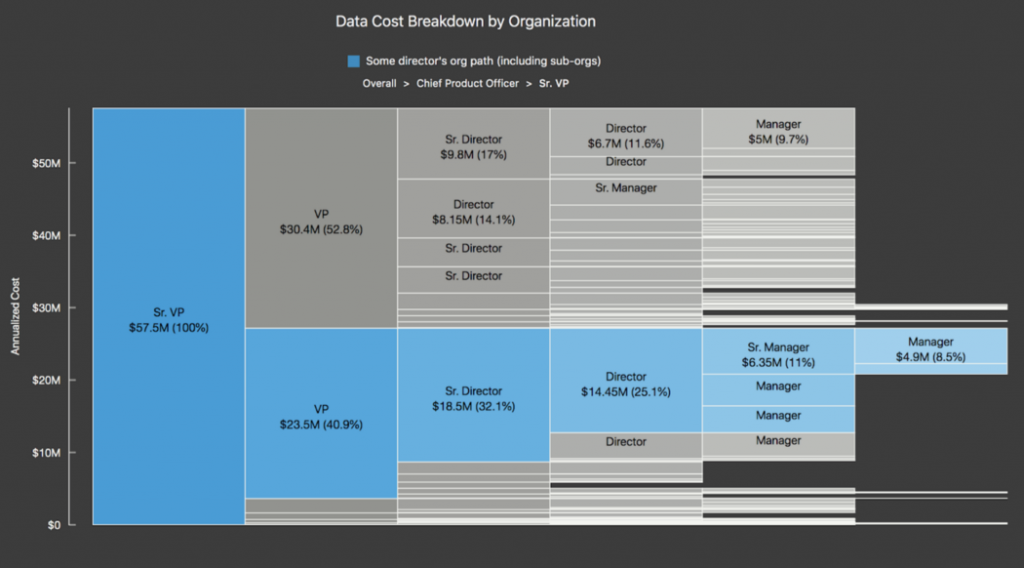
The dashboard that actually displays the data adopts Druid for the backend and groups costs by usage. For example, you can view costs in organizational units or display costs in support units. There is also a dashboard that displays costs in time series. Such dashboards are intended primarily for engineers and data science teams.
In addition to visualizing costs through dashboards, Netflix can also simplify the way data is used. Netflix’s Big Data Warehouse allows owners to freely set expiration, but there is no way to set an optimal expiration date. To improve this situation, we have developed a system that automatically calculates the optimal expiration date for setting storage.
The most expensive thing in S3 is the daily updated transaction table. First, use the S3 access log, the system Metacat, which collects data warehouse metadata, to check which partition was accessible when. It is then a structure to set the optimal validity period by analyzing the longest period of time it took to access again among the access conditions for the past 180 days. It also provides data owners with a dashboard that displays recommended expirations, currently set expiration dates, and savings.
In addition to this dashboard and the expiration date proposal system, we are also building a system that notifies the increase in the cost of using engineer data. It is said that such a system was able to reduce data warehouse storage usage by more than 10%. As a future task, Netflix is planning to promote data use efficiency by seeing that data continuity is maintained when organizations and owners change, and that there is state persistence when data problems occur. Related information can be found here.


Add comment